Five ways I handled my OutOfMemoryErrors
Posted on
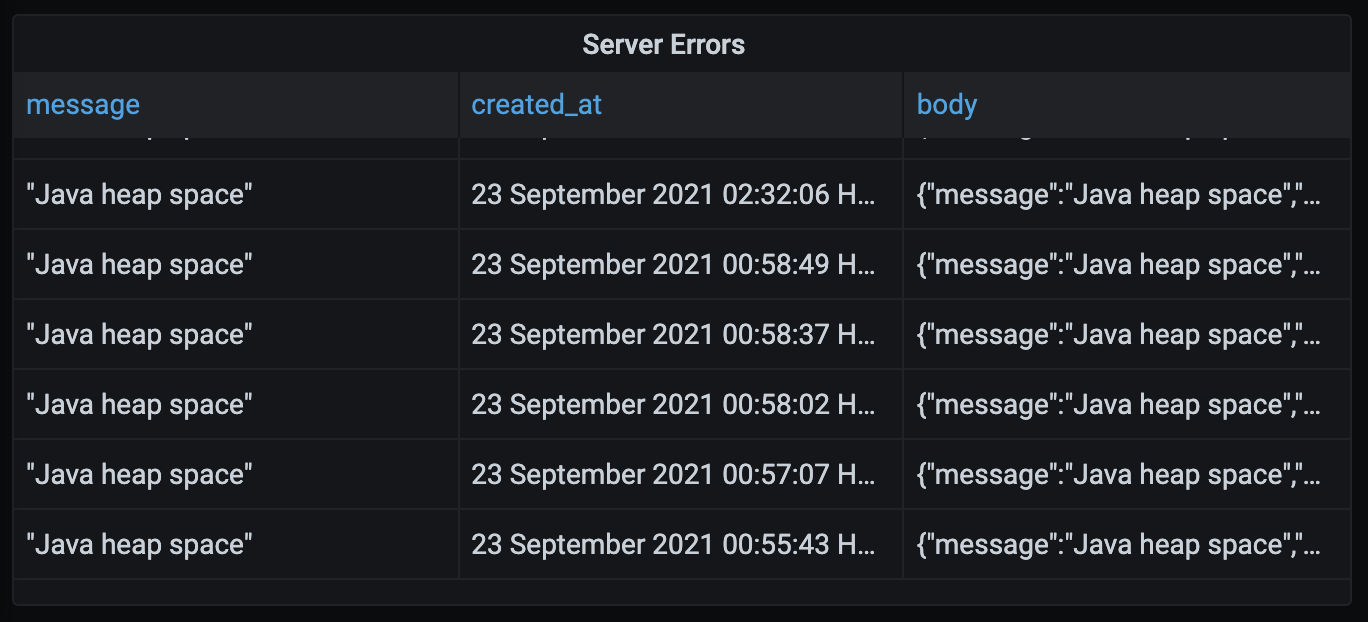
I use Grafana to create graphs that show me various business and performance metrics for Bank Statement Converter. One of the graphs I created tracks the number of Internal Server Errors the server returns to its clients. I do this by writing a record into the database whenever a 500 is sent to the client. This graph has been really helpful for ironing out bugs I didn’t anticipate. Last Thursday at 12:55 AM HKT my servers started throwing Java’s infamous OutOfMemoryErrors.
{
   "message":"Java heap space",
   "errorType":"UNKNOWN",
   "cause":{
      "type":"OutOfMemoryError",
      "detailMessage":"Java heap space",
      "stackTrace":[]
   }
}
A few months ago I ran into a few of these errors and I handled them by upgrading my servers from 1 GB instances to 4 GB instances. Back then I was running tesseract on my servers to OCR image based PDFs. Tesseract uses quite a bit of RAM, so I figured I would need servers with more RAM. I recently replaced tesseract with Amazon’s textract, so I no longer needed extra RAM for OCRing images. When I saw these errors last week I thought “I’m running out of RAM on a 4 GB server? Surely 4 GB is enough to process a PDF file”. I decided to optimise my code instead of throwing more hardware at the problem.
1. Fixing a UI Issue
When a user uploads a PDF and presses the convert button, the UI moves to the /converted page. At this page the UI calls an API which tries to automatically detect the transaction data in the PDF. If that API fails to find the transaction data, the UI moves to the /previewPDF page. At this page the user can select regions to extract. There’s a small bug here that causes the activity in the image below.
![]()
The bottom four transactions show the user called the convert API four times in three seconds. Why would they do this? It took me a while to figure it out, but I finally realised this is what was happening:
1. User uploads a PDF
2. User presses the Convert button
3. UI takes them to the /converted page
4. API says it cannot automatically detect the transactions
5. UI takes them to the /previewPDF page
6. The user presses the back button, the UI takes them to the /converted page
7. Go to Step #4
Basically the user wants to go back to the root page, but the UI eventually takes them back to the previewPDF page. The fix was actually pretty easy.
Before
if (error.errorType === 'FAILED_TO_FIND_TRANSACTIONS') {
	router.push('/previewPdf?uuids=' + uuid)
	return
}
After
if (error.errorType === 'FAILED_TO_FIND_TRANSACTIONS') {
	router.replace('/previewPdf?uuids=' + uuid)
	return
}
This replaces the last URL on the history stack with /previewPdf, and means the user is taken to the root page instead of the /converted page. This is a better experience for the user and also reduces the number of API calls sent to the server. Less API calls means less RAM usage and should help reduce the frequency of OutOfMemoryErrors.
2. Optimising the File Upload API
After fixing the UI, I wanted to reduce the amount of memory allocated when API calls were made. The first thing I did was go to the DEV environmnet and frantically click around in the UI to trigger a lot of API calls. I was able to trigger an OutOfMemoryError. This test is a little unfair since the DEV servers only have 1 GB of RAM whereas the PROD server has 4 GB. Interestingly I was able to hit the errors when uploading a file. That was surprising because not too much happens in the file upload API. When a file is uploaded the following things happen:
- The file is validated to make sure it’s a PDF
- The file is read and classified as either TEXT_BASED or IMAGE_BASED. This is done because image based documents need to be OCRed.
- A record is created in the file_mapping table to link a uuid with a filename
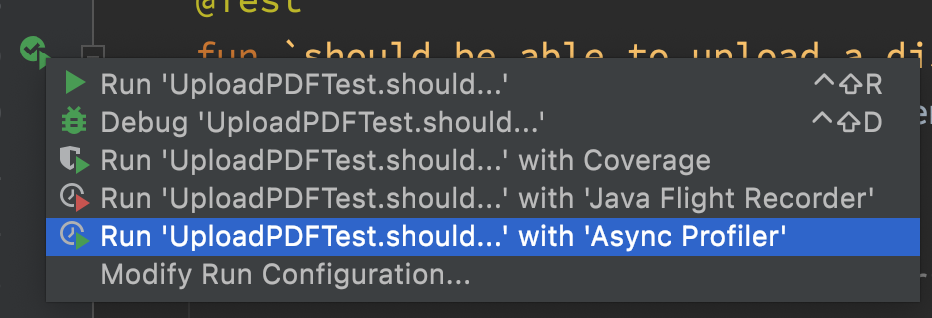
I have a test case for the file upload API, so I triggered that with the Async Profiler enabled. Reading through the report I disocovered my handler allocates 167 MB and the code that extracts text from a PDF was allocating 144 MB. That is a riduclous amount of RAM.
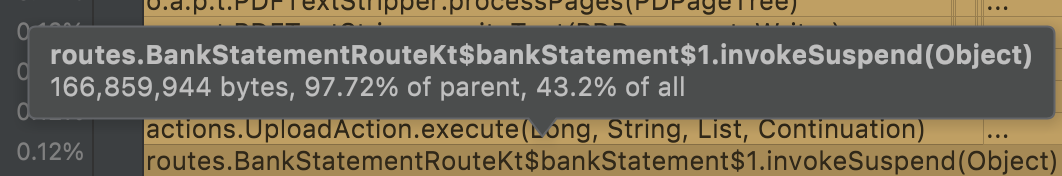
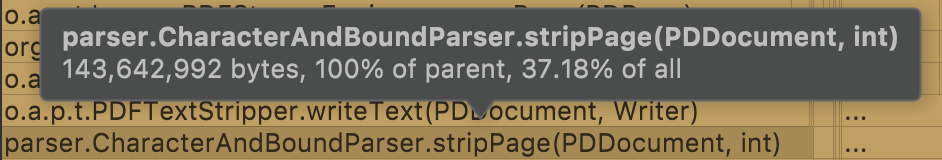
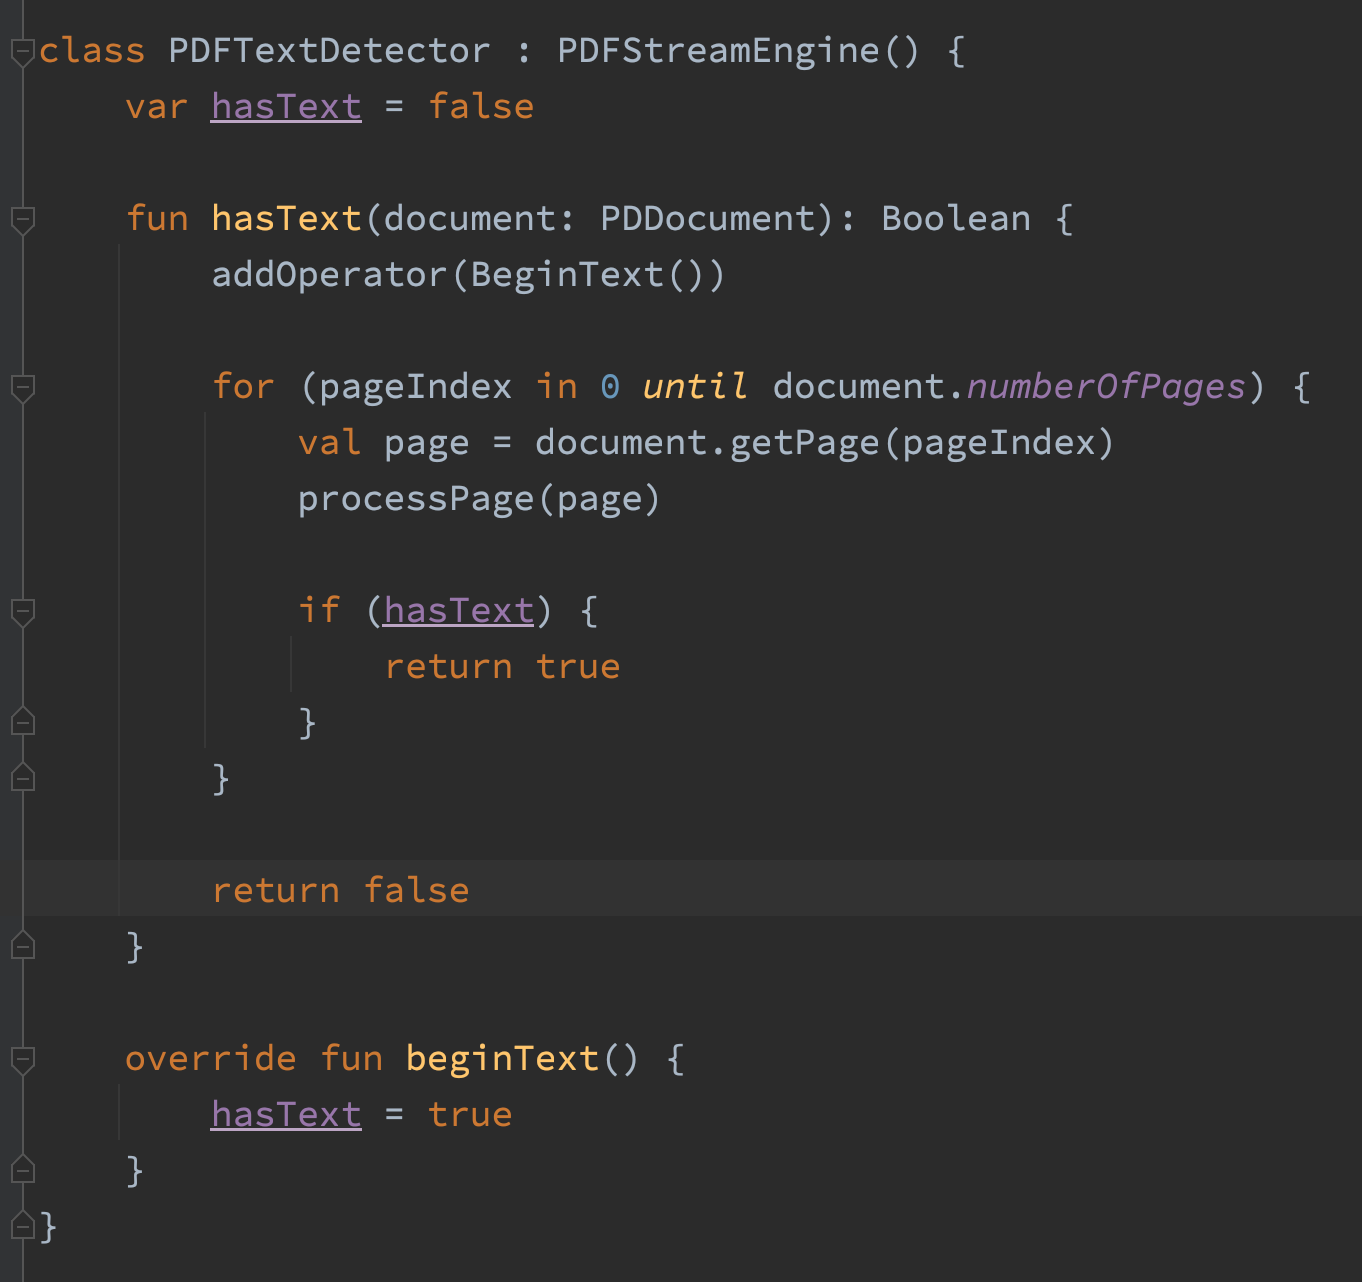
CharacterAndBoundParser.stripPage() returns the color, font, rotation and bounding boxes for all the characters on a page. At the upload stage, all I need to know is whether the document has text, once the code encouters a character it can say “yup it has text” and then stop. So I wrote a class that does that.
After that change the entire file upload route allocates 5 MB which means we’re allocating about 97% less memory than before. Good!
3. Optimising the PDF Conversion API
This optimisation is the coolest, I really enjoyed fixing this issue. I ran the profiler on the code that converts a PDF bank statement into Excel file and looked around for large allocations.
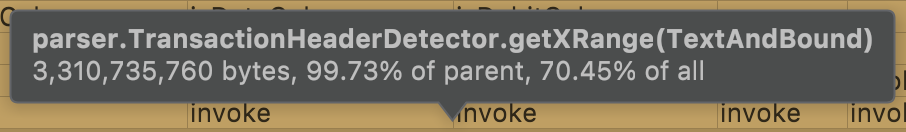
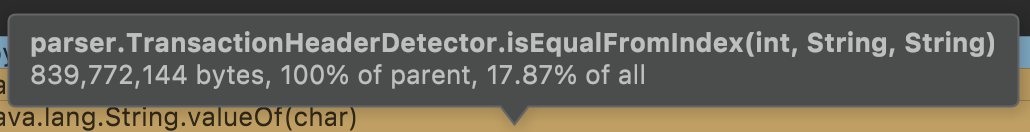
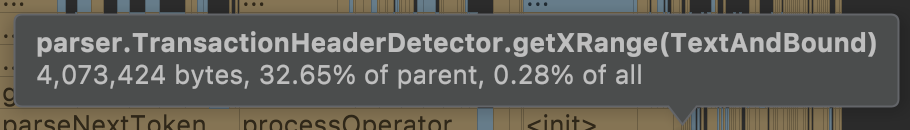
The getXRange() method allocated 3311 MB when processing a 232 page PDF file. This surprised me because the code didn’t seem to be doing very much.
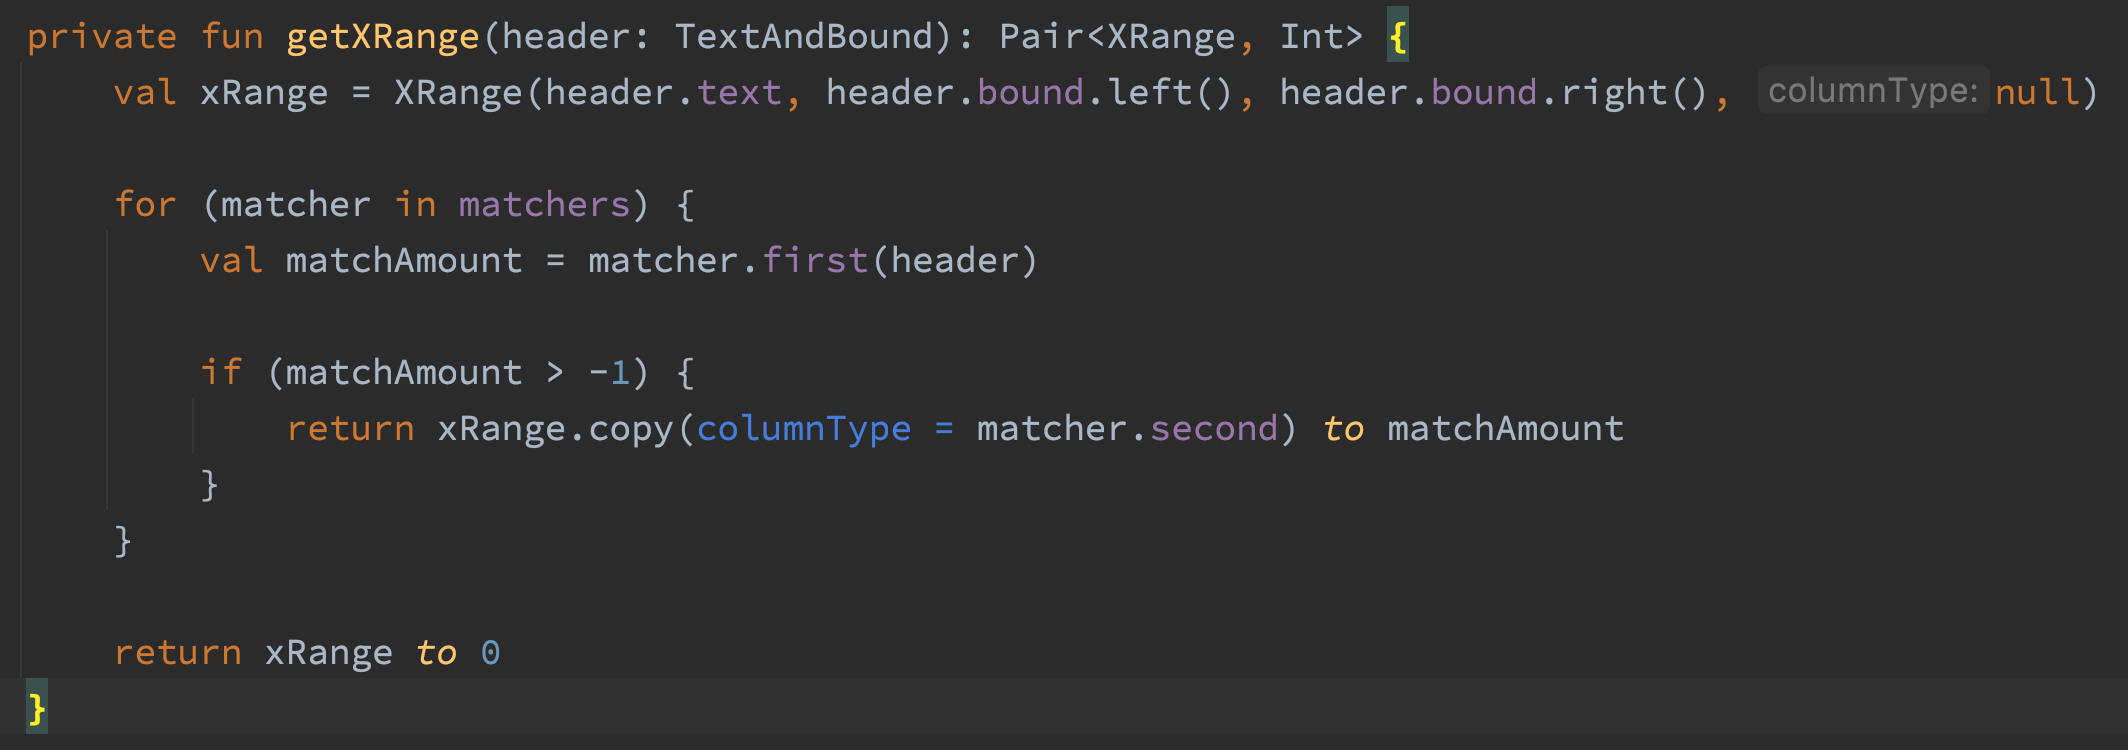
The first line of this code creates an XRange object. That XRange object is only necessary if the text is a transaction header. So I changed the code to only create the XRange if the text matches. I ran the profiler again and… it still allocated 3311 MB. I did a few more things to getXRange but nothing could get it to allocate less memory. Quite a stumper! I looked at the flame graph a bit more and discovered that a method called by all of the matchers was responsible for 100% of the memory allocations in getXRange.
Here’s the code for isEqualFromIndex()
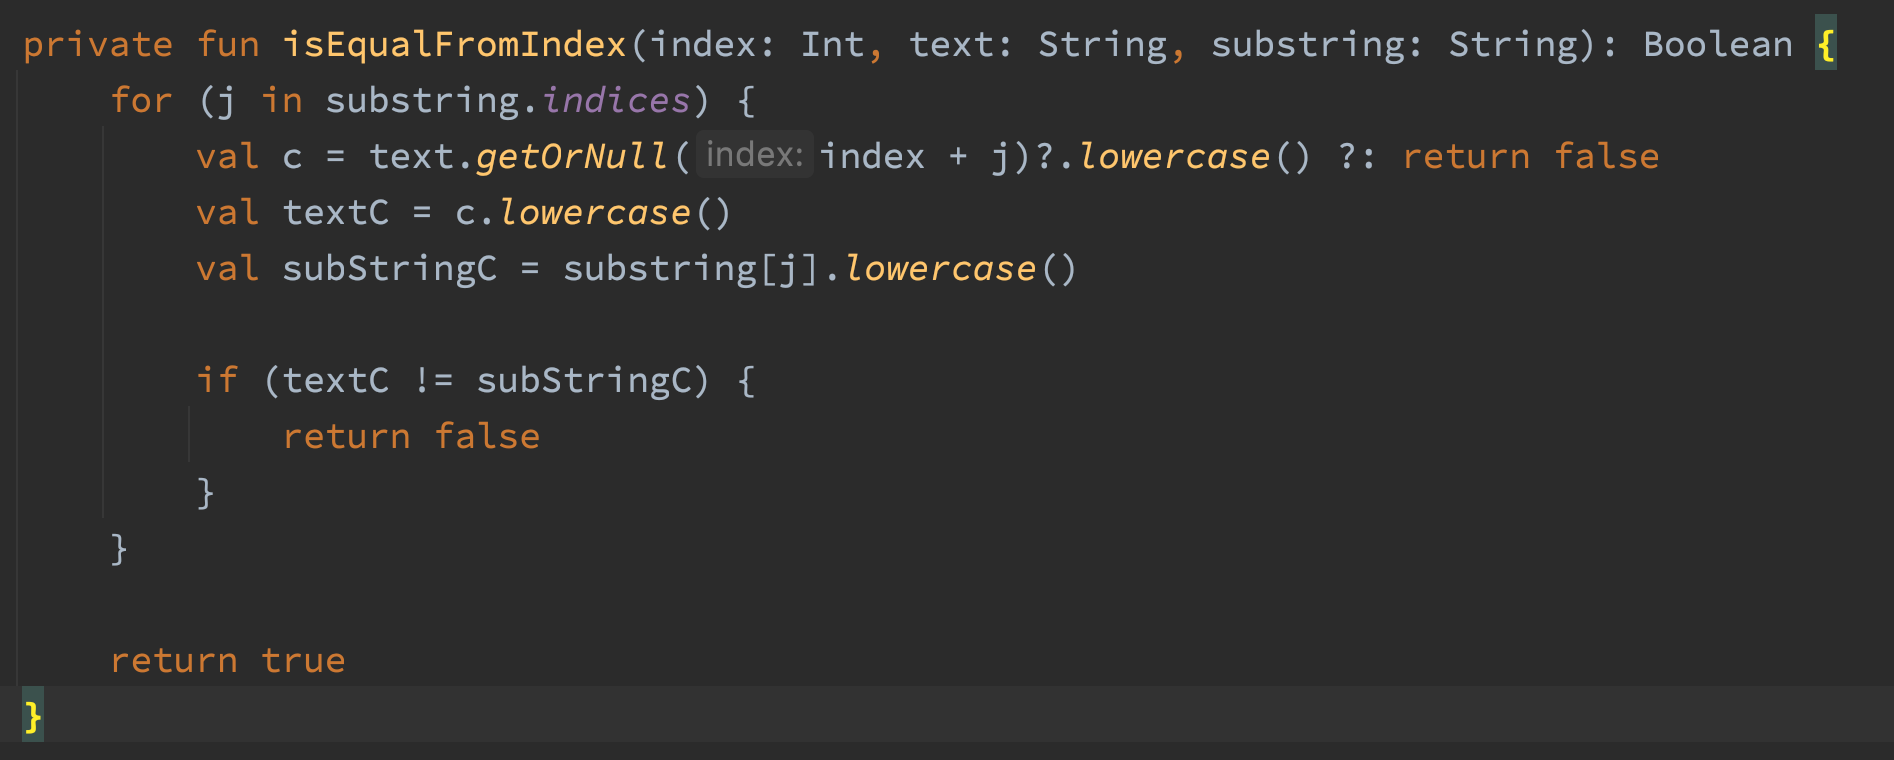
The code uses offsets to check if a substring match exists in a string. The whole reason I wrote this method is to detect case insensitive substring matches in a string without allocating memory. The code works, but it was allocating tons and tons of memory. The naughty parts of the code are the three calls to the lowercase() method. Two calls would be sufficient, so that’s already dumb. The other problem is the lowercase() method returns a String, which means we are allocating three strings in the loop of this method. Gross. Let’s remove those lowercase() calls and do the comparison with Chars instead.
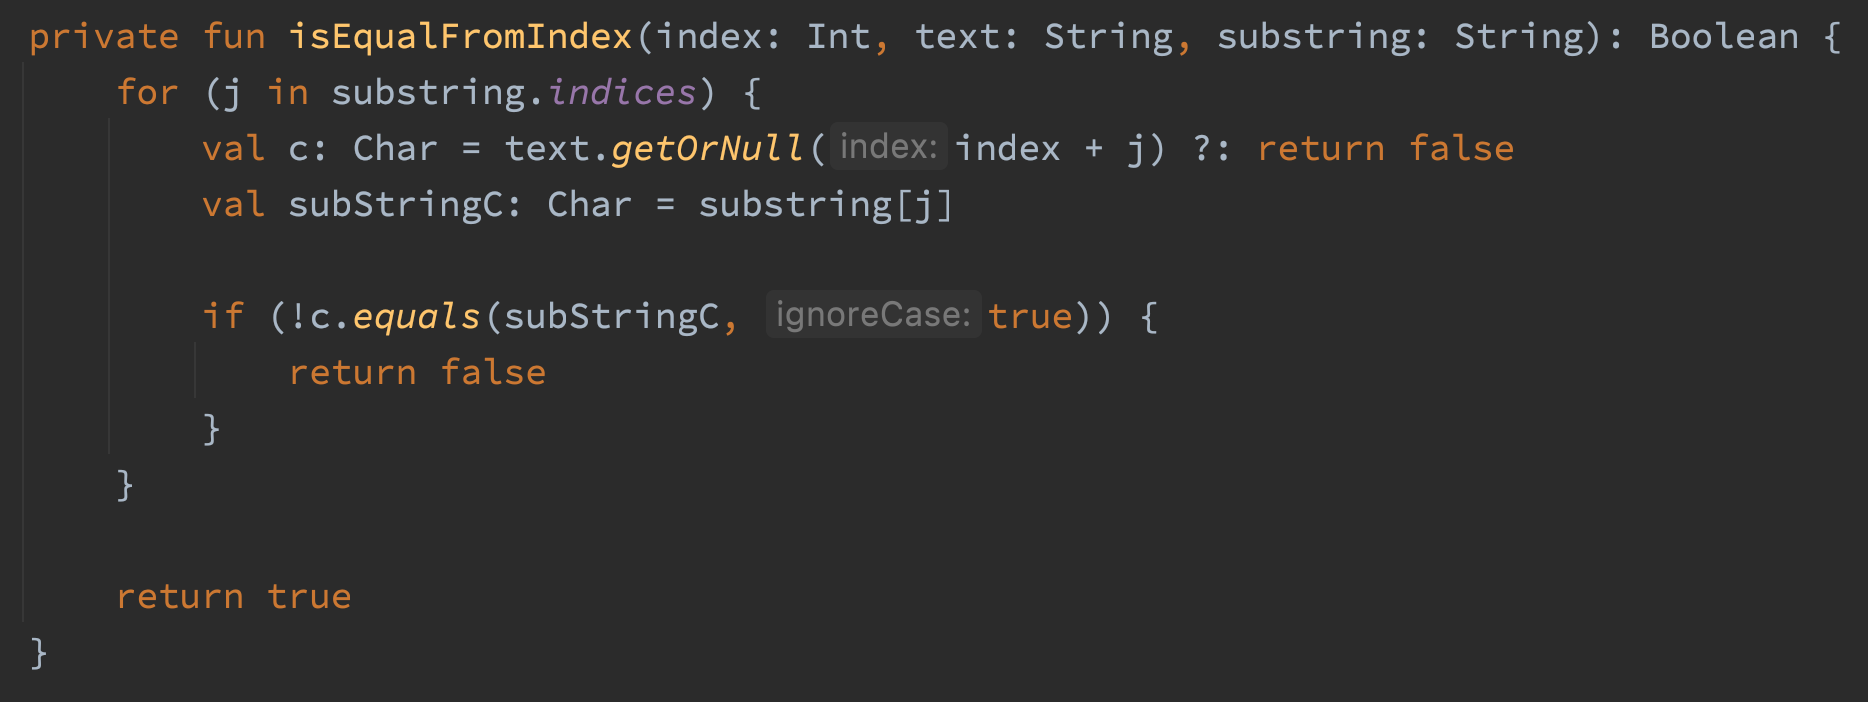
After that change getXRange allocates 4 MB
I really enjoyed this fix because it was such a small change and required zero application knowledge to fix.
4. Optimising Character and Bounding Box Extraction
In optimisation #2 we learned CharacterAndBoundParser.stripPage() allocates a lot of memory. It extends PDFTextStripper which extends LegacyPDFStreamEngine which extends PDFStreamEngine. There is a lot of stuff going on inside PDFTextStripper and LegacyPDFStreamEngine and I suspected I could do without it. I created a class called FastCharacterParser that only extended PDFStreamEngine.
After profiling I learnt FastCharacterParser allocates a lot less memory, but my test cases were failing because I was missing some important functionality in PDFTextStripper and LegacyPDFStreamEngine.
Composed Characters
One of the documents in my test suite encodes the six character word “Office” as five characters “Office” using the ‘fi’ (U+FB01) character. I have no idea why it does this, but it probably isn’t what the user wants. I solved this using a Normalizer class that breaks composed characters into their base characters.
if (0xFB00 <= c && c <= 0xFDFF || 0xFE70 <= c && c <= 0xFEFF) {
   normalized = Normalizer.normalize(c, Normalizer.Form.NFKC)
}
Bold Text
Some documents render text as bold by duplicating the character and shifting it to the left or right slightly. This means the bold version of the text “Hello” would actually be encoded as “HHeelloo”. A few of my test cases render bold text this way. I resolved this by sorting the characters by position and then filtering out characters that are the same and very close to each other.
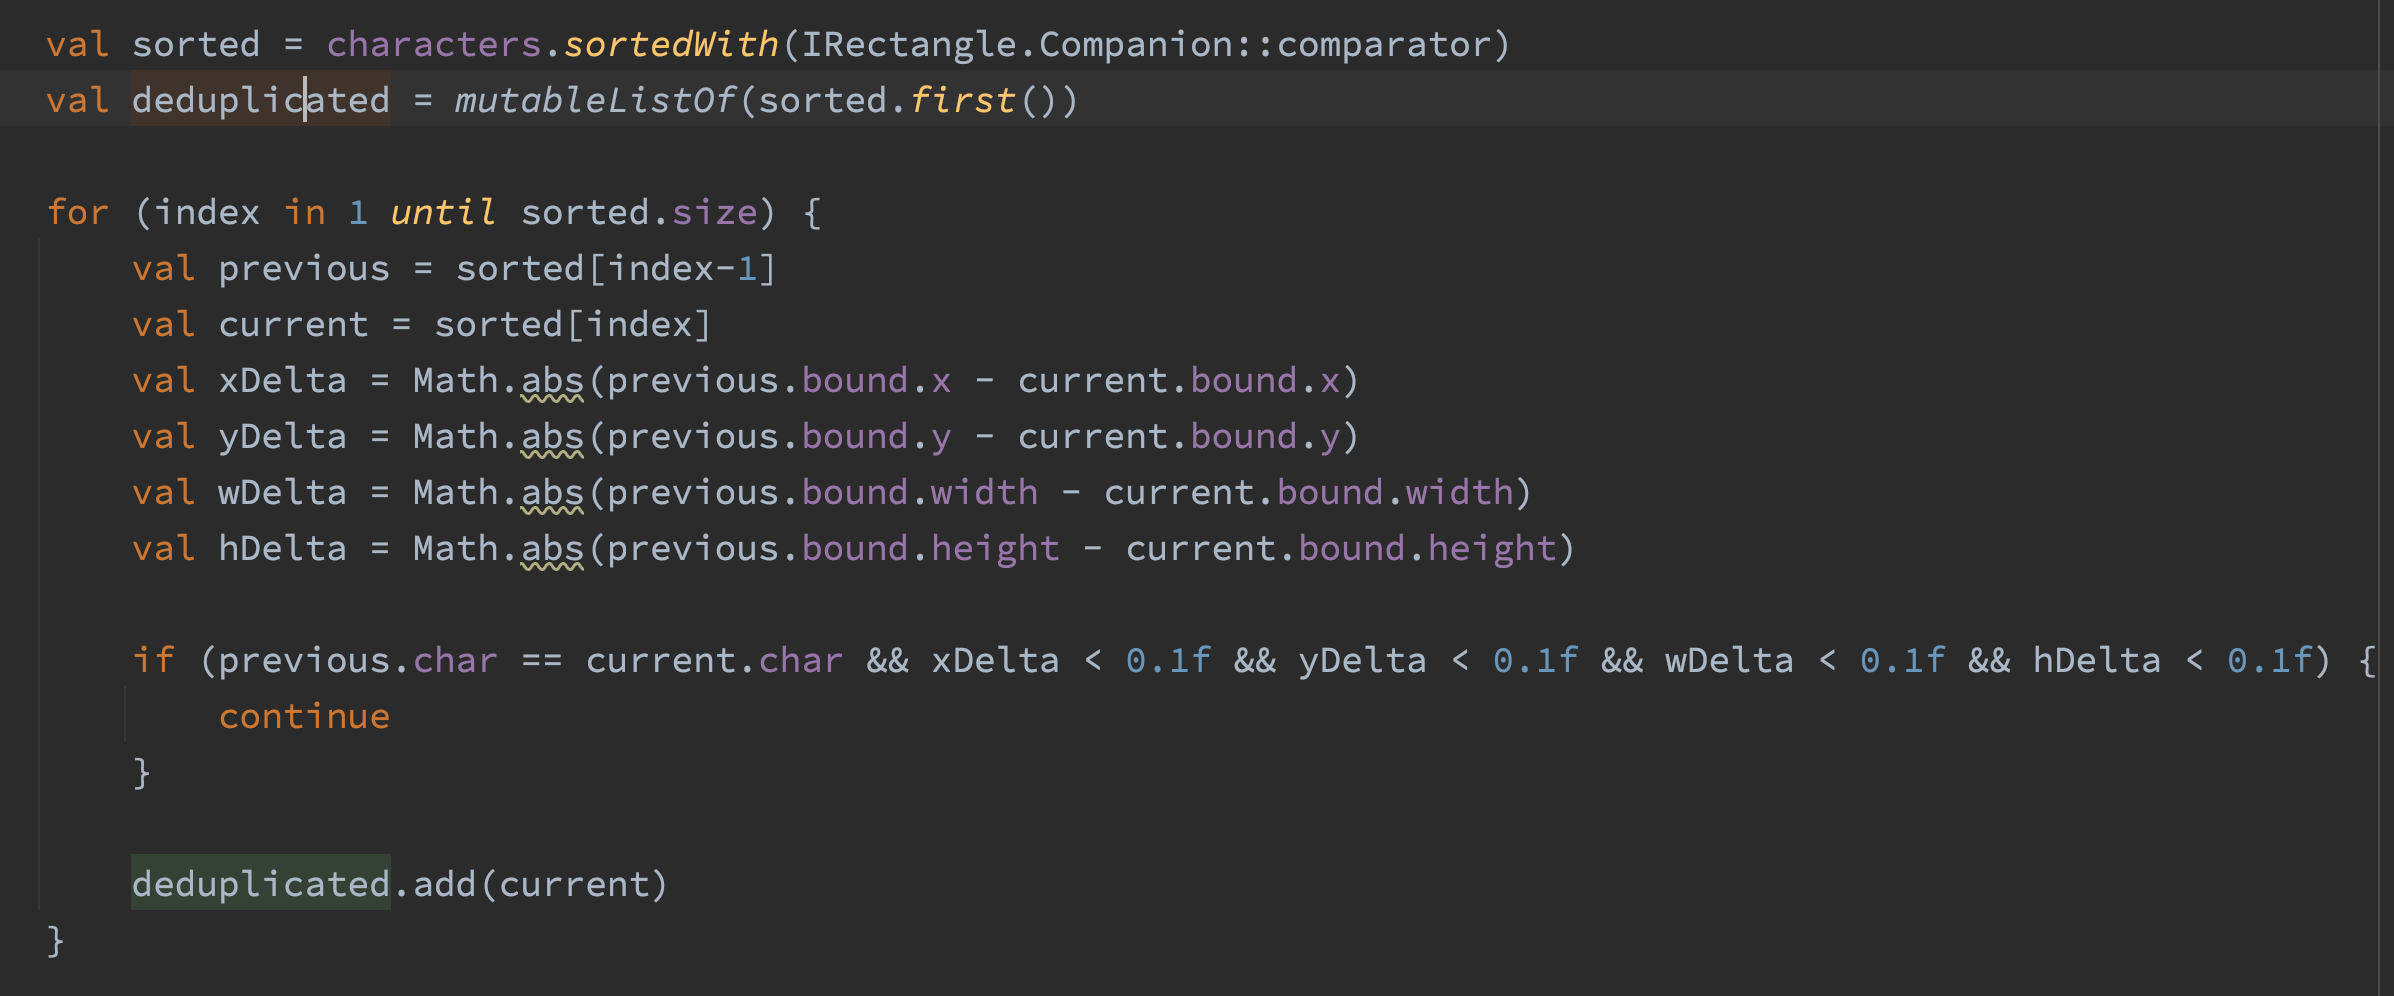
FastCharacterParser allocates 20% less memory when compared to CharacterAndBoundParser. 20% is a signfiicant reduction, but I was a bit disappointed with the results.
5. Optimising Bounding Box Calculations
When processing a large document the showGlyph() method of FastCharacterParser allocates 482 MB of memory, 381 MB of those allocation comes from the AffineTransform.createTransformedShape() method. AffineTransformation are needed to transform a from the coordinate system of the font to the coordinate system of the PDF document.
// Before
var shape = at.createTransformedShape(rect)
shape = flipAT.createTransformedShape(shape)
shape = rotateAT.createTransformedShape(shape)
val bound = Rectangle.from(shape.bounds2D)
Initially I thought about rolling the three AffineTransformations into one and then calling createTransformedShape 1 time instead of three times. Which should reduce allocations from 381 MB to around 130 MB. That’s still a lot of allocations though. I looked through AffineTransform.java and found this happy little method:
public void transform(float[] srcPts, int srcOff,
                      float[] dstPts, int dstOff,
                      int numPts)
This looks a lot more lightweight. I then broke the fonts bounding box into two points, called the transform method and calculated the bounding box myself. This is the resulting code
// Transform the rectangle
val buffer = floatArrayOf(rect.x, rect.y, rect.x + rect.width, rect.y + rect.height)
at.transform(buffer, 0, buffer, 0, 2)
flipAT.transform(buffer, 0, buffer, 0, 2)
rotateAT.transform(buffer, 0, buffer, 0, 2)

// Calculate the bounds of the transformed rectangle
val minX = Math.min(buffer[0], buffer[2])
val maxX = Math.max(buffer[0], buffer[2])
val minY = Math.min(buffer[1], buffer[3])
val maxY = Math.max(buffer[1], buffer[3])
val bound = Rectangle(minX, minY, maxX - minX, maxY - minY)
This results in the showGlyph method allocating 95 MB, which is around 387 MB less than before.
Conclusion
The Async Profiler produces easy to understand reports about the methods in your code that are allocating the most memory. The changes I made have resulted in my application being able to handle significantly more concurrent requests than they could before. You could argue this was a waste of time since my application doesn’t experience a lot of concurrent traffic, however I enjoyed reducing the memory allocations and that’s the most important thing.